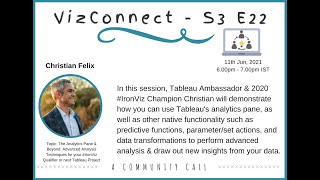
Visualization is a form of communication, just like talking, reading or listening to music. With sight being our primary sense, visual communication has the capability to convey more information in a shorter time frame than almost any other type of interaction. Understanding this is a very small portion of conveying information to other people. You should know where your data comes from, what your customer needs to do with it and, how to package it and finally how to encourage an organization to embrace it. In order to tell a relevant story, there are several steps from data to decision; only one of these steps is creating a visualization.
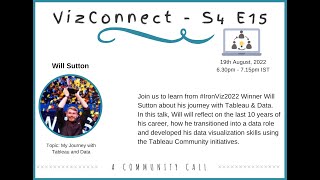
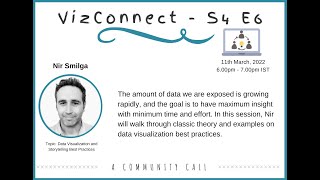
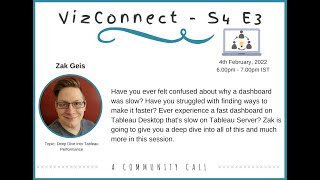
VizConnect is a community call in which Data Enthusiast and Tableau Evangelist will share what key things should be kept in mind to make your analysis and storytelling more effective.


Shared 3 years ago
209 views

Shared 3 years ago
138 views


Shared 3 years ago
100 views

Shared 3 years ago
185 views


VizConnect Tableau Community Data Doctor Session - Calculating Averages, Rates and Weighted Averages
Shared 3 years ago
207 views


Shared 3 years ago
113 views


Shared 4 years ago
138 views


Shared 4 years ago
249 views

Shared 4 years ago
390 views

Shared 4 years ago
116 views


Shared 4 years ago
192 views

Shared 4 years ago
1.4K views


Shared 4 years ago
114 views

Shared 4 years ago
127 views

Shared 4 years ago
133 views

Shared 4 years ago
418 views

Shared 4 years ago
232 views


VizConnect THE 3 2 1 OF ENABLING TEAMS TO BUILD DASHBOARDS THAT DRIVE ACTION, QUICKLY AND REPEATEDLY
Shared 4 years ago
165 views

Shared 4 years ago
553 views

Shared 4 years ago
6.5K views


Shared 4 years ago
1.3K views

Shared 4 years ago
287 views

Shared 4 years ago
260 views

Shared 4 years ago
2.1K views


Shared 5 years ago
351 views