

Data Empire
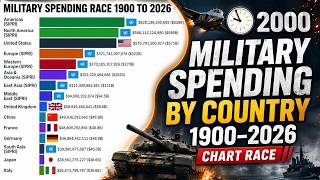
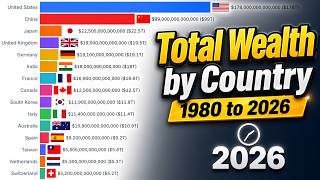
Data Empire creates bar chart race and data visualization videos that show how rankings change over time. You’ll find animated rankings and year by year comparisons about countries, empires, economies, companies, billionaires, technology, wealth, war, military power, population, trade, energy, history, and global power.
Each video turns numbers, timelines, and major events into moving data stories, so big changes are easier to watch and follow.
If you enjoy bar chart race videos, animated rankings, world history, economic history, country rankings, and data visualization, subscribe and watch the rankings change over time.


Shared 1 month ago
1K views


Shared 2 months ago
811 views
