Graph Wars
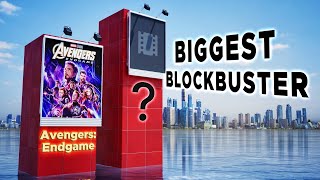
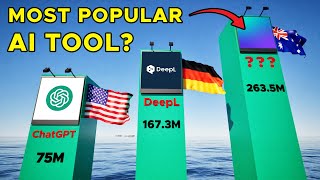
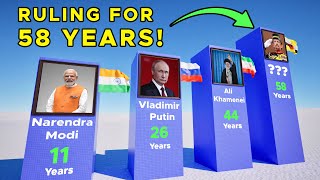
We break down interesting stats visually using beautiful 3D animations and bar graphs. From pop culture face-offs to real-world rankings, we visualize the data that sparks curiosity.
Software used: Autodesk Maya, Twinmotion, Lumion, Adobe After Effects, Adobe Premiere Pro, and Adobe Photoshop
Subscribe to our channel if you like our videos!


Shared 9 months ago
21 views

Shared 9 months ago
42 views

Shared 10 months ago
56 views


Shared 11 months ago
99 views


Shared 1 year ago
423 views


Shared 1 year ago
4.8K views