32:43
Can Chatbots Do Math
cylurian
0:50
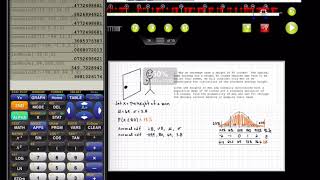
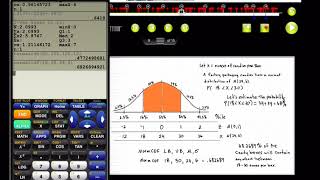
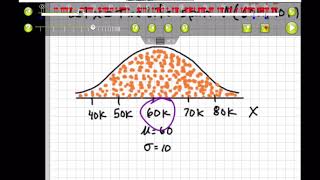
Understanding the Sampling Distribution of the Mean
16:10
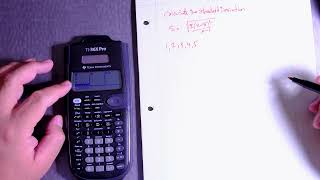
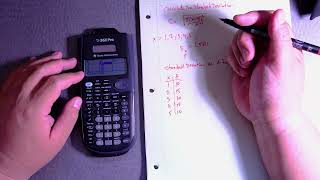
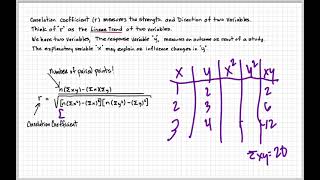
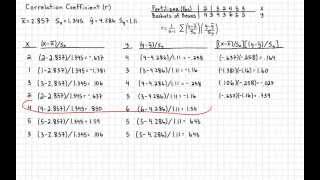
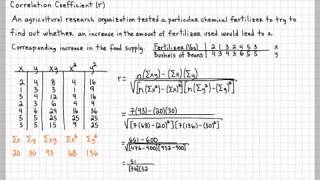
Calculate the Correlation Coefficient - r
12:47
Pen + Gear Calculator - Standard Deviation
17:03
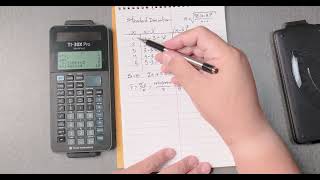
TI-30X PRO - Standard Deviation
13:00
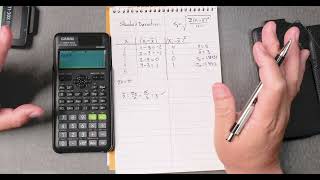
Casio FX 300ES - Standard Deviation
21:13
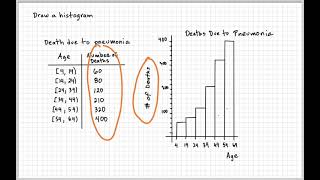
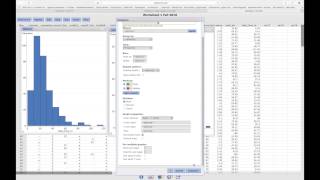
Histogram Fall 2024
6:03
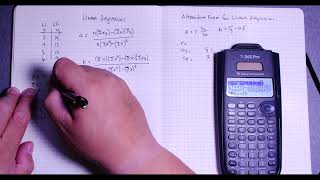
Sums for Linear Regression TI-36X Pro #maths #chemistry #science
3:09
Sums for Correlation Coefficient #maths #science TI-36X-Pro
8:16
Correlation Coefficient #maths #TI TI-36X Pro
1:50
TI-36X Pro Calculate the standard deviation
2:54
Find the Median with Ease: TI-36X Pro Calculator & Table Data
4:07
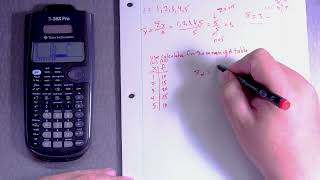
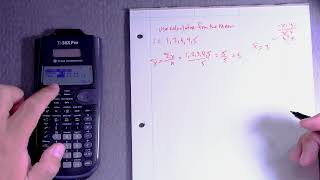
TI-36X Pro Calculate Mean with Data on Table
15:14
TI-36X Pro Tutorial: Calculating Standard Deviation Made Simple
1:38
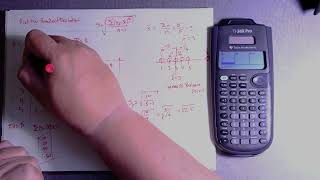
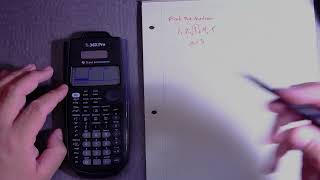
TI-36X Pro Calculate the Median
2:52
TI-36X Pro Calculate Standard Deviation (Data in Table)
TI-36X Pro Calculate the Mean
7:39
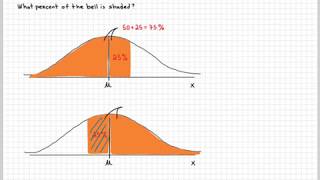
Leftward Lean: Delving into Left-Shaded Areas in Normal Distribution
6:41
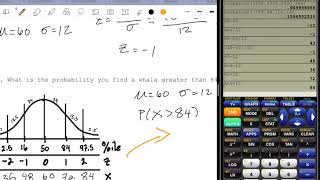
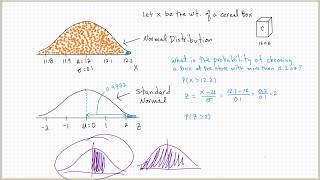
Beyond the Curve: Solving Greater-Than Probability Challenges in Normal Distribution
6:07
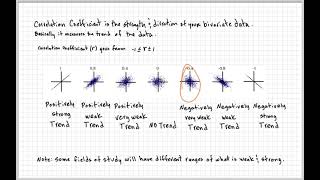
Connect the Dots: Uncovering Data Patterns with the Correlation Coefficient!
9:00
On the Trail of Variability: A Data Detective's Guide to Standard Deviation!
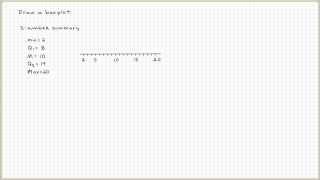
4:39
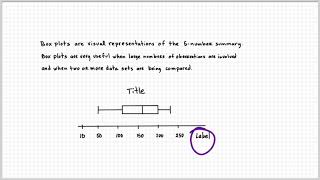
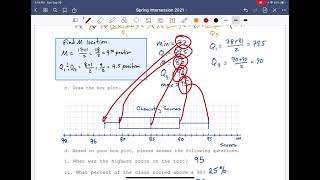
Box Plot Treasure Hunt: Data Detectives on a Numbers Adventure!
4:12
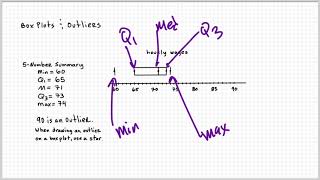
Outlier Investigations: Navigating Box Plots Like a Data Detective
4:32
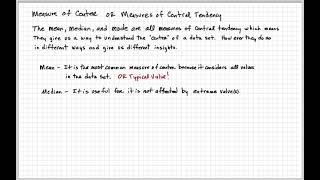
Data Detectives in Action: Deciphering the Magic of Mean, Median, and Mode!
2:22
Average Avengers: Unleashing the Power of the Mean!
3:52
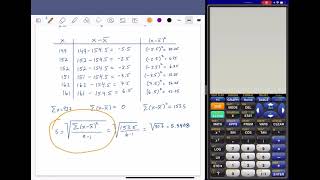
Decoding Data: Your Friendly Guide to Sample Standard Deviation
10:39
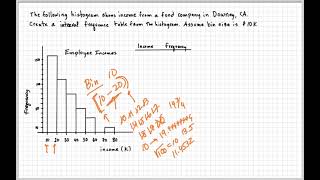
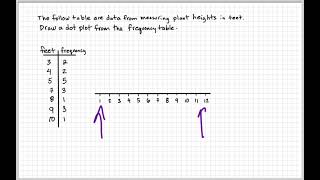
Histogram to Frequency Table
4:49
Bar Graph vs Histograms
7:19
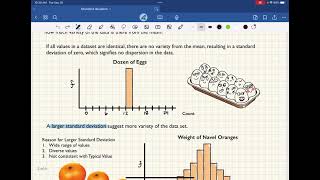
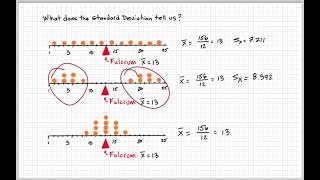
The Meaning of Standard Deviation
18:17
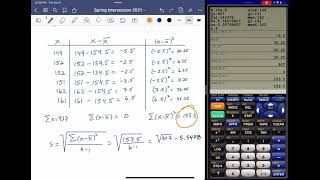
Standard Deviation Worksheet
6:17
Dot Plot
3:42
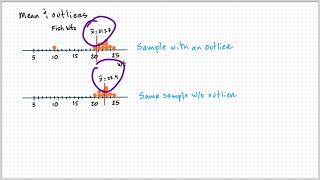
Outliers
20:01
Correlation Coefficient Worksheet
11:32
Standard Deviation with TI Calculator
20:46
Box Plot worksheet
7:35
Strong and Weak Correlation
2:34
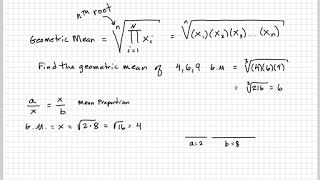
Geometric Mean
52:23
Normal Distribution Worksheet
25:22
Normal Distribution Part 3
52:13
Normal Distribution Part 2
45:24
Normal Distribution part 1
7:17
ClassCalc Correlation Coefficient Linear Regression Correlation of Determination
40:23
Linear Regression
1:44
TI 83/84 - Linear Regression
1:31
TI 83/84 - Mean
1:33
TI 83/84 - Median
0:48
TI 83/84 - Population Standard Deviation
0:49
TI 83/84 - Sample Standard Deviation
2:05
TI 83/84 - Correlation Coefficient
11:00
Graphical Way of Explaining the Standard Deviation
6:30
Variation from the Mean - Sample Standard Deviation
5:07
Linear Regression Explained Geographically
29:20
Sampling Mean Distribution
9:19
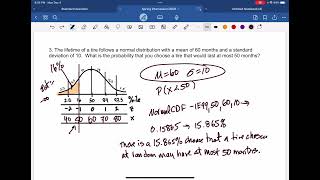
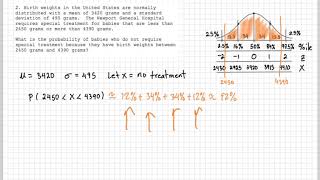
Normal Distribution Word Problem
2:58
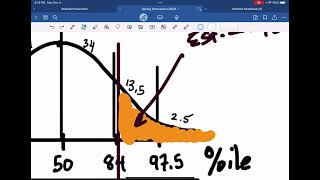
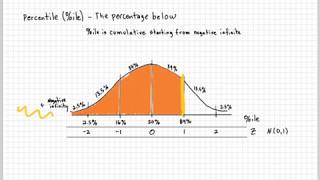
Percentiles for the Normal Distribution
9:53
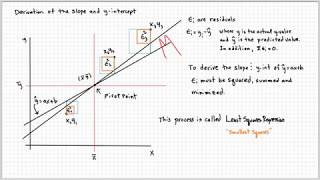
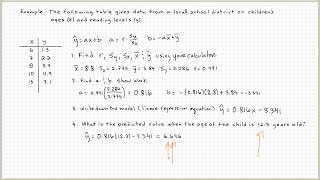
Linear Regression (y-hat)
8:49
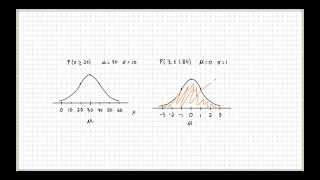
Shading The Normal Distribution to find the probability
12:37
Finding the probability of the Normal Distribution
3:18
Statcrunch Correlation Coefficient and Regression
16:01
Drawing Normal Distribution Curve
10:43
StatCrunch - Box Plot
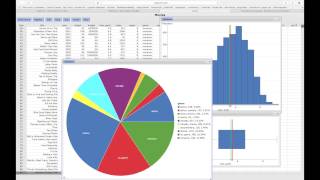
5:20
StatCrunch - Histograms
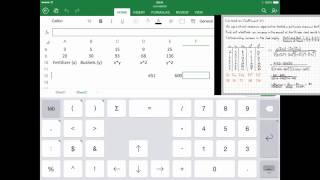
iPad Excel to Calculate the Correlation Coefficient
5:49
Mean Absolute Deviations (MAD)
5:45
Box and Whisker Plot (box plot)
12:05
Dot Plots and Frequency Tables
2:23
Calculating the Mode (Mode Explained)
20:59
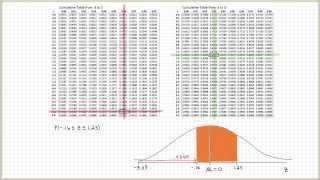
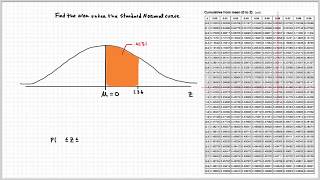
Standard Normal Distribution Table Explained
4:43
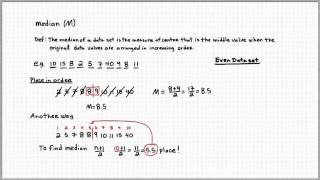
Statistics - Calculating the Median
12:45
Alternative Method Correlation Coefficient
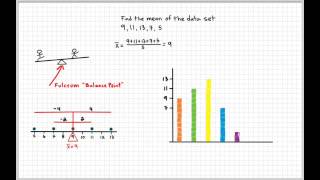
4:15
Arithmetic Mean | Fulcrum | Balance Point
13:39
Normal Distribution Table | Z-table | How To READ
How to Find Outliers in Statistics
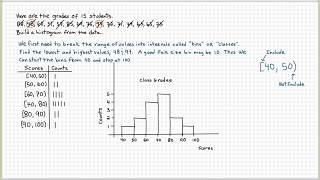
13:21
Histogram Explained
10:03
Normal Distribution
11:03
Linear Regression Y-hat
9:15
Correlation Coefficient
13:02
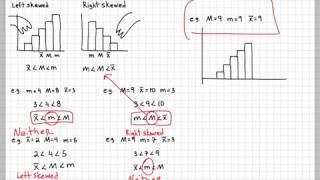
Skewed Histogram (Left Skewed Right Skewed Histogram)
12:52
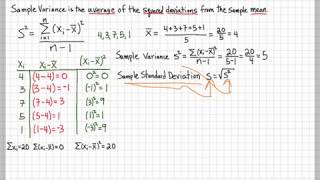
Sample Variance and Sample Standard Deviation