2:00
Inforiver Analytics+ | 3-in-1 visual with 50+ charts, cards & tables for Power BI
Inforiver
1:56
3 Things Only a Inforiver Waterfall Chart Can Do | Inforiver
1:59
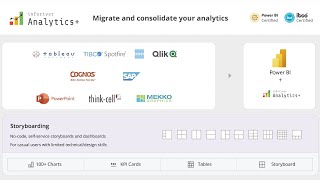
Analytics Plus | Migrate and Consolidate your analytics in Power BI
What's New in Inforiver Analytics+ 4.3 | 100+ Charts, Cards, and Tables for Microsoft Power BI
13:19
Get Started with Inforiver Analytics +
5:09
Analytics+ - Introduction
2:01
Inforiver Charts - Modern Data Visualizations Suite in Power BI
2:49
IBCS visualizations in Inforiver Charts
47:58
Inforiver Charts - Fastest Way to Visualize your data stories inside Microsoft Power BI
LIVE
[Private video]
Inforiver Charts 2.1 - February 2023 Update
1:11
How to Configure Trellis Mode in Inforiver Analytics+ | Step-by-Step Power BI Tutorial
2:47
How to Customize Trellis Layout in Power BI Using Inforiver Analytics+
3:19
Styling small multiples in Power BI using Inforiver Analytics+
1:49
Master 4D Hierarchies in Power BI with Inforiver Analytics+ | Advanced Data Visualization Tutorial
4:33
Ranking in Inforiver Analytics+ | Power BI Custom Visual Ranking Demo