1:20
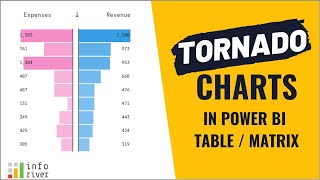
Building Tornado Charts inside your Table/Matrix for Microsoft Power BI
Inforiver
LIVE
[Private video]
1:48
Using bullet charts in a table/matrix in Microsoft Power BI
1:02
Waterfall charts inside table/matrix in Microsoft Power BI
1:03
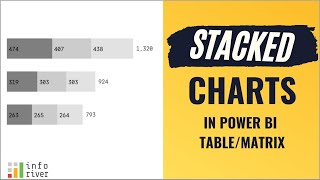
Stacked Charts in a table/matrix in Microsoft Power BI
1:52
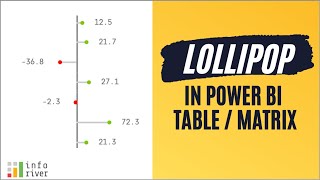
Using Lollipop Charts in a table/matrix in Microsoft Power BI
1:16
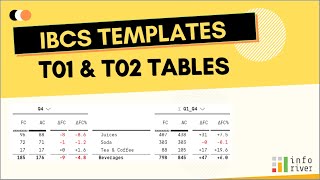
IBCS-compliant templates (T01 & T02) in Microsoft Power BI
2:17
Using sparklines in table/matrix in Microsoft Power BI
1:57
Bullet Charts for Comparing Three Measures in Power BI
0:48
Advanced Bar charts in Power BI Table/Matrix
0:32
Using Column as measure in Power BI table/matrix
1:08
Set versions based on categories in Power BI table/matrix