3:42
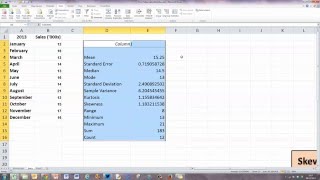
How To... Display a Range of Descriptive Statistics in Excel 2010
Eugene O'Loughlin
4:46
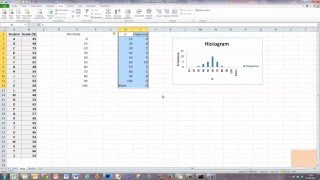
How To... Draw a Simple Histogram Excel 2010
4:18
How To... Add an Image as a Background in Excel 2010
3:25
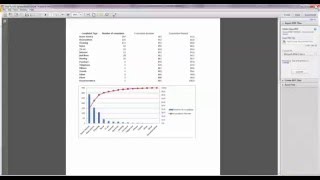
How To... Save a Spreadsheet as a PDF File in Excel 2010
6:27
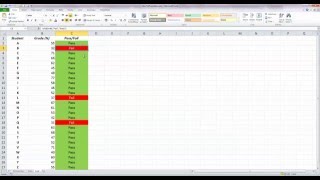
How To... Use Basic Conditional Formatting with an IF Statement in Excel 2010
5:36
How To... Add an Average Line to a Line Chart in Excel 2010
7:34
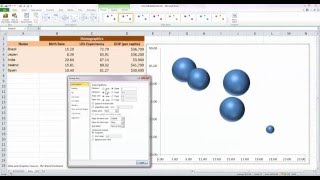
How To... Draw and Format a Basic Bubble Chart in Excel 2010
5:00
How To... Perform Simple Linear Regression in Excel 2010
10:22
How To... Calculate a Correlation Coefficient (r) in Excel 2010
8:30
How To... Perform a one-way ANOVA Test in Excel 2010
7:52
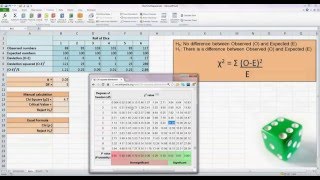
How To... Perform a Chi-Square Test in Excel 2010
8:16
How To... Calculate Student's t-Statistic (Independent Samples) Using Data Analysis in Excel 2010
8:38
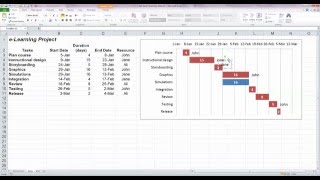
How To... Edit a Basic Gantt Chart in Excel 2010
5:29
How To... Use the VLOOKUP Function in Excel 2010
8:15
How To... Draw a Basic Control Chart in Excel 2010
4:52
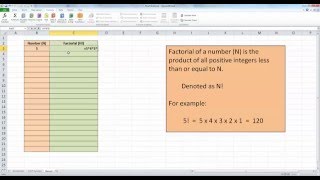
How To... Calculate the Factorial of a Number in Excel 2010
9:03
How To... Draw a Simple Box Plot in Excel 2010
4:58
How To... Plot a Simple Scattergram in Excel 2010
4:33
How To... Draw Simple Line Charts in Excel 2010
8:37
How To... Calculate Data Range and Sample Variance in Excel 2010
6:49
How To... Calculate Data Mean, Median, and Mode in Excel 2010
5:23
How To... Add a Line of Best Fit in Excel 2010
4:12
How To... Create a Resource Histogram in Excel 2010
8:01
How To... Create a Progress Gantt Chart in Excel 2010
7:21
How To... Plot Multiple Data Sets on the Same Chart in Excel 2010
4:54
How To... Display Two Measures in a Bar-Line Chart in Excel 2010
6:47
How To... Calculate a Weighted Moving Average in Excel 2010
6:19
How To... Calculate Simple Moving Averages in Excel 2010
5:04
How To... Create Quick Charts in Excel 2010
6:59
How To... Calculate Mean and Standard Deviation in Excel 2010
5:05
How To... Create a Stacked Chart in Excel 2010
3:34
How To... Draw a Basic Scatter Diagram in Excel 2010
3:41
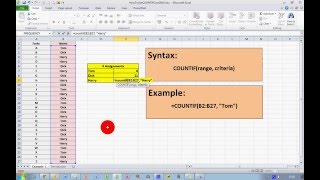
How To... Use the COUNTIF statement in Excel 2010
7:43
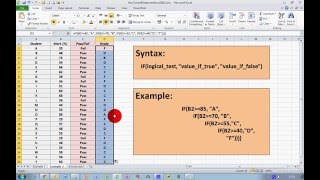
How To... Use If Statements in Excel 2010
6:02
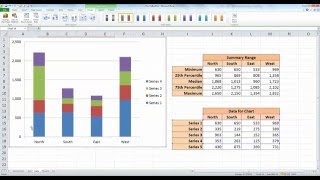
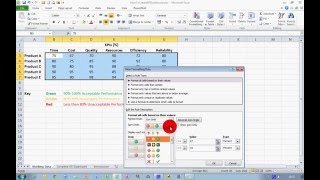
How To... Create a Basic KPI Dashboard in Excel 2010
7:08
How To... Use Subtotals for Data Analysis in Excel 2010
How To... Create a Basic Pivot Table in Excel 2010
7:07
How To... Create a Simple Filter in Excel 2010
5:48
How To... Add and Change Chart Titles in Excel 2010
LIVE
[Private video]
6:41
How To... Plot a Normal Frequency Distribution Histogram in Excel 2010
6:00
How To...Create a Basic Gantt Chart in Excel 2010
4:57
How To...Copy Formulas in Excel 2010
4:22
How To...Sort Data in Excel 2010
4:17
How To...Draw a Simple Pie Chart in Excel 2010
6:13
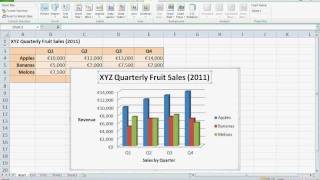
How To... Draw a Simple Bar Chart in Excel 2010
6:55
How To... Create a Pareto Chart in Excel 2010
6:58
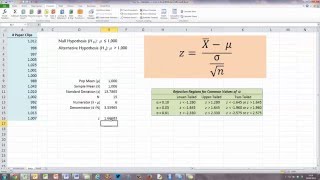
How To... Calculate a z-Statistic in Excel 2010
9:50
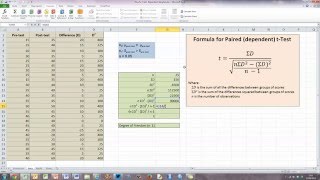
How To... Calculate Manually Student's t Statistic (Dependent Samples) in Excel 2010
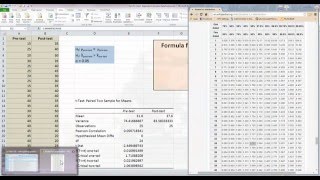
How To... Calculate Student's t Statistic (Dependent Samples) using Data Analysis Tools in Excel
How To... Calculate Manually Student's t-Statistic (Independent Samples) in Excel 2010