10:18
Office Parking Utilization Dashboard in Excel
PK: An Excel Expert
12:43
Client Billing Dashboard in Excel
10:54
Supply Chain Report in Excel
12:16
Office Security Incident Dashboard in Excel
Safety and Compliance Dashboard in Excel
13:12
Sales Business Intelligence Dashboard in Excel
11:34
Employee Productivity Dashboard in Excel
14:10
IT Support Ticket Dashboard in Excel
14:48
Insurance Brokers Dashboard in Excel
13:42
Procurement Analysis Dashboard in Excel
12:47
Employee Turnover Dashboard in Excel
17:09
Customer Satisfaction Dashboard in Excel
12:03
Pharmaceutical Dashboard in Excel
6:18
Profit and Loss Chart in Excel | Step by Step tutorial
6:41
Stylish Progress Bar Chart in Excel | Step by Step tutorial
10:07
Highlight Top and Bottom N in Excel Chart | Step by Step tutorial
20:06
Pro Gantt Chart in Excel with Data Entry Form || Complete Tutorial
10:16
Credit Rating Meter Chart in Excel | | Step by Step Tutorial
5:43
Sales Funnel info graphics in Excel | Step by step tutorial
5:48
Dynamic chart for Top Selected Employees with GROUPBY and TAKE function
9:37
Candle info-graphics chart in Excel | Step by step tutorial
8:12
Convert your boring bar chart into Stylish charts
6:26
How to WOW Your Boss: 3D Progress Circle in Excel 🚀
8:53
Mind-Blowing Excel Hack: 3D Waffle Charts in Just Steps
7:26
An Effective Stacked Column Chart with Integrated Totals
15:48
Excel Magic: Stunning Animated Progress Circle Charts for Project Tracking
16:11
Dynamic KPI indicator with SEQUENCE and CEILING Function in Excel
7:57
Dynamically Highlight Topper Student on the Chart in Excel
11:58
Use of Symbols and Emojis in Excel Drop-down List and Excel Charts
15:12
Quick 3D Container Chart in Excel
13:37
Quick Male/Female Ratio and Waffle Chart in Excel
8:07
Multi-color Data bar with REPT function in Excel
13:40
Find Top Employee with FILTER, SORT and RANK Function in Excel
11:11
Sales Analysis Heat Map by Time and Day
10:26
Dynamic Circle Chart in Excel
10:10
Stylish Column Chart in Excel
10:05
3D Chart for Weekly Sale in Excel
20:45
KPI Dashboard with Tooltip in Excel
12:24
Cross Filter Functionality in Excel Chart
15:44
Dynamic Comparison in Butterfly Chart
9:28
3 Useful Tips for Pivot Chart in Excel
12:56
Dynamic Comparison Analysis Chart in Excel
19:17
Vertical and Circular Bullet Chart in Excel
25:49
10 Pro Tips for Excel Charts
23:24
Dynamic Hourly Project Planner (Gantt Chart)
26:27
Power Gantt Chart (Project Planner) for Project Management
23:04
Stylish and Dynamic Comparison Chart | No Excel Shape or Picture used
15:36
Dynamic Filled map in Excel | Connect with Wikipedia page to get population Data
15:51
Multicolor Filling Bars in Excel Cells Without using Chart
36:39
Top Bottom Analysis Dashboard in Excel
21:52
Info-graphics: Smart Chart with Laptop Shape in Excel
26:14
Dynamic Sales Score Meter Chart with Form Control Combo box and List box
15:41
Info-graphics: 3D Gauge Chart in Excel
15:58
Fully dynamic Chart in Excel with Scroll bar and Spin button form controls
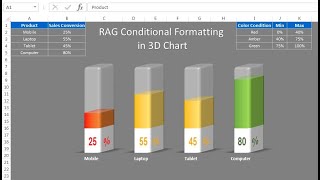
21:18
Info-graphics: RAG Conditional Formatting in 3D Chart
16:13
Medical Science Info-graphic Chart in Excel
19:13
Beautiful 3D Visualization in Excel
14:40
Powerful Feature: Drill Down/Drill Up Feature in Pivot Chart
12:08
5 Layered Advanced Doughnut Chart
17:53
RAG waffle Chart visualization with Slicer
13:06
Dynamic Performance Chart in Excel
11:22
Info-graphics: Timer Chart Visualization in Excel
14:01
Animated Speedometer Chart in Excel
8:14
Part-2: Dynamic Variance Arrows Chart with Slicers
18:49
Dynamic Variance Arrows Chart with Check Boxes
15:55
Info-graphics: Group of Circle Charts in Excel
10:24
Dynamic Chart with Form Control Scrollbar
15:25
Data Visualization: Word Cloud in Excel Using VBA
9:45
Forecast Vs Actual Chart with Safe Zone Range in Excel
5:32
Excel Tip: Apply Same Format on other Charts
5:04
Excel Tip: Show Hidden/Collapsed Cells data on the Chart
10:06
Dynamic Chart with Option Button for Employees Count by Age group
12:06
Dynamic Chart with Slicer for Employees Count by Age group
13:54
Info-graphics: Multiple KPIs Visualization in Excel
6:52
Horizontal Timeline Chart using Scatter chart in Excel
9:23
Vertical Timeline Chart using Scatter chart in Excel
10:50
Stylish Waffle Charts in Excel Without Macro
15:11
Spotlight Visualization in Excel (Part-1) | Dynamic RAG (Red, Amber, and Green) Stoplights
11:12
Spotlight Visualization in Excel (Part-2) | Highlight your top performer with Spotlight
12:26
Stylish Pivot Chart with Slicer in Excel
7:58
RAG (Red-Amber-Green) Analysis Chart in Excel || Line Chart with RAG Background
14:24
3D Container Pivot Chart with Slicers and Timeline
8:47
3D Filled Pyramids Chart in Excel
Dynamic Sales Funnel Chart with Slicers
4:04
3D Disk Pie Chart in Excel || Learn in less than 5 Minutes
1:21
Our World Class Charts, Dashboards and Excel Tips and Tricks
10:20
Info-graphics: Stunning Thermometer Chart in Excel
8:40
Small Charts for Weekly Performance || Useful Charts for Excel Dashboard
8:01
Info-graphics: Beautiful and Stylish Circle Chart in Excel
8:13
Innovation: Fish Chart in Excel
10:29
Info-graphics: Conditional Formatting in Lollipop Chart || Learn 4 different Variants of this Chart
10:15
Info-graphics: 3D Glass Chart in Excel
7:36
Info-graphics: Flag Chart in Excel
15:32
Innovation: Analog Clock in Excel (Pie + Doughnut Chart)
Stylish Butterfly Chart (Version-2)
10:39
Stylish Butterfly Chart (Version-1)
10:03
Informative KPI Indicator Chart (Version-1)
10:53
Innovation: Focus Chart in Excel
12:32
VBA: Dynamic Charts in User Form
12:33
Info-graphics: Slider Meter Chart (Version-3)
10:34
Info-graphics: Slide Meter Chart (Version-2)
10:02
Info-graphics: Slide Meter Chart (Version-1)
7:53
Conditional Formatting in Line Chart
12:22
Highlight the Specific data point in a Line Chart Dynamically
13:22
Info-graphics: Animated Hour Glass Chart in Excel
5:58
An Innovative chart for team level performance
10:57
A Stunning Circular Chart for KPI Metrics
12:14
Info-graphics: 3D KPI Indicator in Excel
8:11
Info-graphics: Filling Stacked Column Chart in Excel
21:15
Dynamic Project Planner (Gantt Chart) Part-2
11:07
Dynamic Project Planner (Gantt Chart) Part-1
Info-graphics in Column Chart (Part-2)
12:53
Info-graphics with Column Chart (Part-1)
14:33
Info-graphics with Line Chart
10:36
Chart Templates in Excel
14:19
Employee Wise Deficit and Surplus Sales Chart
13:29
Conditional Formatting in Stylish Doughnut Chart
11:44
Stylish Doughnut Chart in Excel
8:10
Multilayered Doughnut Chart : Part-2
14:11
Multilayered Doughnut Chart : Part-1
11:16
Dynamic Step chart in Excel
14:23
Stunning Battery Chart in Excel
RAG Condition Formatting in Progress Circle chart in Excel
11:05
Yesterday Vs Today Sales Chart in Excel
13:30
3D Doughnut Chart for KPI Metrics
Weekly Sales chart in Excel
13:07
Animated Progress Circle Chart
9:01
Chart in Excel Cells
11:38
Info-graphics: Iceberg Chart in Excel
12:13
Info-graphics: Construction Projects Completion Status chart
18:17
Animated Car Chart in Excel
Yearly Revenue Chart in Excel
17:19
Heatmap Table in Excel
13:57
Dynamic Chart: Target Vs Actual Sales
Project Timeline/Milestone Chart in Excel
13:03
Info-graphics Chart Series: Video - 3
15:10
Info-graphics Chart Series: Video - 2
13:45
A Stunning Chart to display 5 KPI Metrics together
9:47
Half Circle KPI info graphic chart
12:51
Info-graphics Chart Series: Video - 1
19:04
4 Speedometers in one chart
19:10
3 Speedometers chart in one chart
18:07
2 Speedometers Chart in one Chart
Dual Indicator Speedometer Chart in Excel
15:17
Stunning Performance Meter Chart in Excel
19:18
Multiple Drill down chart in Excel
Dynamic Chart with Cell function in Excel
Male and Female Info-graphics in Excel
Text Filling Chart In Excel
10:32
Progress Bar chart in Excel
12:21
Info-graphics: A designer Cone chart in Excel
12:17
Info-graphics: KPI Chart in Excel
12:30
Infographics: Filling Circle Chart in Excel
15:02
RYG Dial Gauge meter In Excel (Without Macros)
14:15
Progress Circle chart in Excel 2010
15:33
Infographics: Star Rating Chart in Excel
20:28
Infographics: Comparison between two teams in Excel
11:10
Infographics: Car Racing Chart in Excel
Info-graphics: Bulls Eye Chart in Excel
10:08
Fly High: Target Vs Actual chart in Excel
11:43
A Hunter Spider Chart: Analyse your data in different way
5:09
Spider web chart in Excel
Interval wise dynamic Chart in Excel
14:50
Ultimate Thermometer Chart in Excel
10:28
Balloon Chart in Excel
6:40
Bubble Chart with 3 Variables in Excel
12:25
Ultimate Speedometer in Excel: Part 2
Ultimate Speedometer in Excel: Part 1
4:55
Sales Pyramid Chart in Excel
5:45
Double Doughnut Chart in Excel
7:21
Pie of Pie Chart in Excel
17:18
Project Plan(Gantt Chart) in excel
8:08
Convert Simple Chart to infographics
9:07
Infographics: Capsule Graph in Excel
8:29
PK's Excel Graph Book
3:34
Horizontal Bullet Chart in Excel
17:40
Traffic Lights in excel
8:41
Vertical Bullet Chart in Excel
9:34
Tornado or a Butterfly Chart in Excel
12:29
Infographics: Progress Circle Chart in Excel
12:01
Infographics: KPI Indicators with excel cells
11:36
How to use Picture effects in Excel Chart
14:51
Notice board with sticky note in excel
8:16
Infographics : Highlight the Top performer in your graph
10:45
Infographics: Survey Graph in Excel
13:17
Amazing KPI graph in Excel
17:35
Truck Graph to show Occupancy or workload in Excel
17:02
Road and Flag infographics chart in Excel
Conditional Formatting in Multiple batteries Graph in Excel
11:20
Learn how to create attractive Pie Charts in Excel
6:51
How to create teams goal Graph
15:07
Beer Mug Graph in excel
Cigarette Graph in Excel without using of VBA
8:27
How to create a battery chart in excel
12:04
Dynamic graph with Camera in Excel
9:49
How to use Conditional formatting in Excel Chart
6:22
How to create a lollipop chart in excel