8:34
Mastering Matplotlib: Matplotlib line plot with example | line chart matplotlib
AGEOFDATA
19:15
Learn to use subplot in matlablib with figure method | subplots in matplotlib
5:34
Understand how to use Coloring, Line Width, and Transparency in matplotlib by @newageofdata
6:57
Understand how to use linestyle in Matplotlib by Ageofdata - matplotlib tutorial
7:29
Learn to change marker size, marker color and more in matplotlib - matplotlib tutorial
14:29
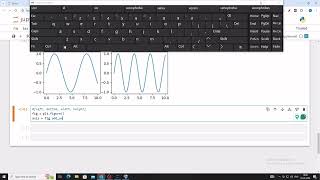
Learn to draw multiple plots on the same figure with matplotlib | matplotlib example
8:01
Learn To use jointplot seaborn with example | seaborn tutorial
6:41
Learn to use pairplot in seaborn for data visualization | seaborn Tutorial
8:19
Understand the kernel density estimate in seaborn | kernel density estimate
10:50
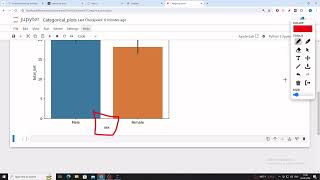
Learn to use categorical plot in seaborn | sns countplot
6:47
Learn to handle seaborn boxplot multiple columns | boxplot seaborn | boxplot python
18:22
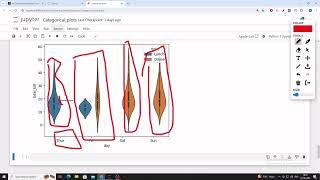
How to make violinplot in seaborn with multiple category | seaborn tutorial
9:35
How to use Stripplot in Seaborn in Python | Seaborn Tutorial
16:01
Learn to use heat maps in python with all parameters | heatmap in python
7:33
How to use PairGrid in seaborn | pairgrid vs pairplot
7:20
Learn to use FacetGrid in Seaboarn | sns facetgrid
13:36
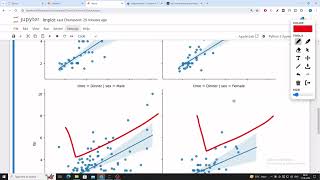
Learn to use lmplot in seaboarn | lmplot in python
10:39
How to set style in seaboarn for styling | Seaborn Styling
9:13
How to use seaborn with data set & pandas | Seaborn Project
12:24
Seaborn Project part 2: Learn to use line and hexbin plot with pandas
3:41
How to plot scatter plot with ploty | plotly Tutorial
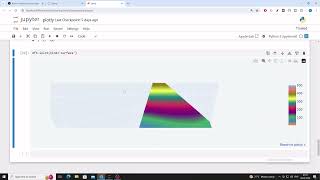
How to Make 3d surface Plot with plotly | 3d surface plot python
11:36
How to make candlestick chart in plotly | plotly candlestick chart
10:47
How to set width and height of chart in plotly | plotly.express python
10:38
How to make a bubble chart in Plotly with Python
12:41
Understand Exploratory Data Analysis With Python | EDA In Data Analysis
15:56
Understand the need of Data Analytics Project Lifecycle Step by step
10:41
Understanding Object Data Type with Discrete and Continuous Data in EDA
10:55
Learn to use Pivot table in EDA for beginners | EDA projects for beginners
12:29
Learn Pivot Tables with Pandas Crosstab Example | Step-by-Step Guide
21:02
Pandas Melt Function Explained: Convert Wide Data to Long Data Easily
33:06
How to add feature engineering in data analytics | Data analytics project
34:17
Spotify Dataset Visualization: A Data Visualization Project In Python
36:44
How to Handle Negative and Positive Skewness In Data Analytics
26:02
Learn to use IQR method to detection outlier in data analysis
23:23
z score method for outlier detection for data analytics | Z score technique
15:05
How to Handle Outliers with Log Transformation in Data Analytics
22:03
Learn to use Winsorization In python method to handle outliers
23:12
Python EDA Project 1: NHANES BMI & Blood Pressure Insights
22:25
EDA Project 2 PART 2: How to create word cloud in Jupyter Notebook
27:57
EDA Project 2 PART 3: Create a Treemap in Python for Car Dekho Dataset
29:23
Python EDA Project 3 Part 2: Data Visualization on Udemy Courses Dataset
26:39
Beginners EDA Project 4 Part 2: Learn To split Dataframe into multiple Dataframes
53:21
EDA Project 5 Part 2: Powerful Feature Engineering with Pandas GroupBy”
38:16
Plotly Tutorial with Python: Use go.choropleth to plot world map for Gold Medal Winner