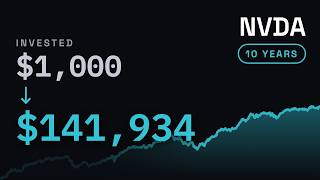
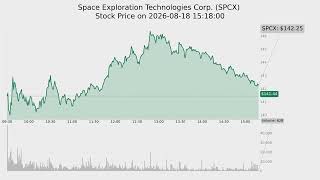
Stock market history you can watch. $1,000 invested in one ticker.
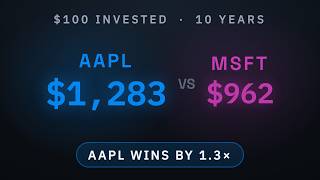
Two stocks head to head over a decade. Ten years of earnings in a
single chart.
One question per video, answered by the data — no face, no opinions,
no price targets.
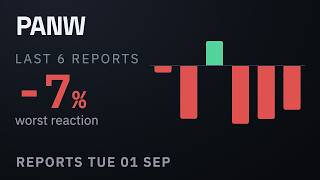
Regular series: $1,000 invested • Head to head • Earnings history •
Daily movers • IPO debuts
Sources: total-return prices adjusted for splits and dividends;
revenue and profit from SEC filings. Derived numbers are marked
as derived.
Educational and informational only. Nothing here is investment advice.
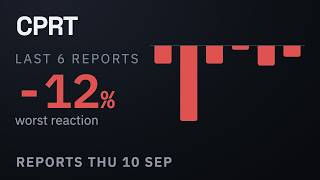


Shared 7 hours ago
14 views

Shared 23 hours ago
3 views


Shared 1 day ago
0 views


Shared 2 days ago
10 views


Shared 6 days ago
32 views

Shared 6 days ago
2 views

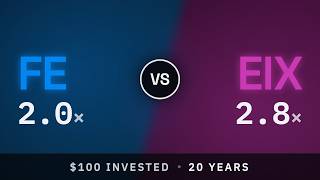
Shared 1 week ago
3 views



Shared 1 week ago
9 views

Shared 1 week ago
3 views


Shared 1 week ago
3 views


Shared 1 week ago
15 views


Shared 1 week ago
9 views


Shared 2 weeks ago
11 views


Shared 2 weeks ago
6 views


Shared 2 weeks ago
21 views


Shared 2 weeks ago
28 views


Shared 2 weeks ago
2 views